Policies
A description of the different policy methodologies for the Embodied Carbon Policy Reduction Calculator for Buildings
Building Reduction Target Policy
The building reduction target policy represents a type of policy that requires projects to meet a percent reduction target, verified using results from a whole building life cycle assessment (WBLCA). This policy model is indicative of a building-scale policy that requires projects to model a baseline building (also referred to as a reference building) and a proposed building, which reflects their actual design. For examples and more information about this policy framework, see the CLF Building-Scale Embodied Carbon Performance Requirements factsheet.
In this tool, a user can model a policy that implements a required percent reduction between baseline and proposed. The policy can be applied to life cycle stages A1-A3, A1-A5 or A-C. After the user selects a percent reduction from the baseline, the tool calculates the reduction in ECI on the applicable life cycle stages and physical scopes.
- ECI(L)pred= Reduced ECI of life cycle stage L of physical scope p
- PR = Percent reduction input by user
- ECI(L)pbase= Baseline ECI of life cycle stage L of physical scope p
Then, the tool sums the total ECI per physical scope and life cycle stage chosen by the user to create a reduced ECI per typology. Physical scopes and life cycle stages not chosen by the user for reduction shall use the baseline ECIs.
- ECItred= Reduced ECI of typology t
- ECI(L)pred= Reduced ECI of life cycle stage L of physical scope p. This will be summed over the user-selected physical scopes and life cycle stages.
- ECI(L)pbase= Baseline ECI of life cycle stage L of physical scope p. This will be summed over the physical scopes and life cycle stages not selected by the user.
Finally, the tool sums the total GWP per typology by multiplying the user-selected applicable areas to the reduced ECI and the non-selected areas to the baseline ECI.
- GWPtotal = Total GWP of all typologies
- TYP = typologies of Commercial, Multifamily Residential, and Single Family Residential
- Area(t)app= Area of typology t selected by user to be applied to reduced ECI
- Area(t)NA= Area of typology t not selected by user to be applied to baseline ECI
Building Embodied Carbon Budget Policy
The building embodied carbon budget policy represents a type of policy that sets a “cap” or maximum allowable embodied carbon intensity (e.g. kgCO2e/m2), verified using results from a WBLCA.
For this tool, embodied carbon budgets were calculated from the CLF WBLCA Benchmark Study v21 dataset and tabulated at the 25th, 50th, and 75th percentile. These values are the basis for the reductions calculated by the tool and are tabulated below. ECB modeling is not permitted for single family residential due to lack of benchmark data.
| Typology | 25th Percentile | 50th Percentile | 75th Percentile |
|---|---|---|---|
| Commercial | 330 | 422 | 568 |
| Residential | 208 | 311 | 417 |
| Typology | 25th Percentile | 50th Percentile | 75th Percentile |
|---|---|---|---|
| Commercial | 361 | 466 | 611 |
| Residential | 245 | 343 | 473 |
The policy outcomes of ECBs in a dataset is driven by the number of buildings that fall above and below the thresholds. To approximate this behavior, we tested the influence of the ECBs in the Benchmark v2 public dataset across projects by typology, and translated those outcomes into proxy percentages in order to simplify the modeling for the calculator. The final proxy percentage values are the average of ECB results of buildings modeled with structure and enclosure and the buildings modeled with structure, enclosure, and interiors.
The user can choose the 25th, 50th, or 75th percentile embodied carbon budget. The proxy percent reductions are tabulated below.
| Typology | 25th Percentile | 50th Percentile | 75th Percentile |
|---|---|---|---|
| Commercial | 26.7% | 14.2% | 4.5% |
| Multifamily Residential | 39.3% | 21% | 8.4% |
Using these proxy percentages, the tool uses the procedure in Eqs. 1-3 to calculate the total GWP of the policy.
Material Policies
Material policies typically establish a maximum allowable Global Warming Potential (GWP) per unit of product for each category and require an environmental production declaration (EPD) to verify compliance with the product GWP limit. This policy framework is most commonly applied in public procurement policies – often referred to as Buy Clean – that set embodied carbon requirements for major construction materials on public projects. However, product GWP limits are also set in other contexts, such as CALGreen’s embodied carbon requirements. In the context of this tool, material policies are limited to concrete and steel, though Buy Clean policies sometimes include glass, insulation, asphalt, and other materials. For examples and more information about this policy framework, see the CLF Buy Clean Policies: Overview + Implementation factsheet. The following sections detail the level of specificity that can be selected for concrete and steel material policies.
Concrete
Given a user's choice of location, the concrete policy model will access regionally specific
values from NRMCA's regional benchmarks of concrete EPDs2. See
image below for a map of NRMCA regions. 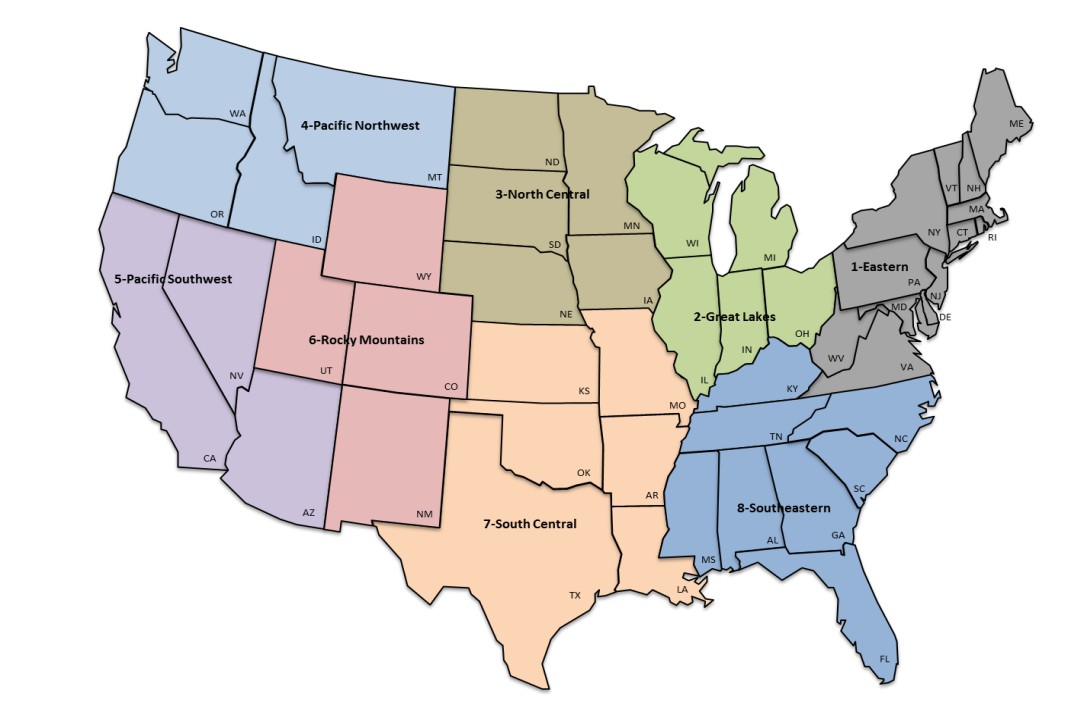 The user can choose up to a 40% reduction from national or regional averages. These values can be
explored with different regional selections and are tabulated below.
The user can choose up to a 40% reduction from national or regional averages. These values can be
explored with different regional selections and are tabulated below.
| Concrete Mix | ECI |
|---|---|
| Ready mix NW 2500 | 0.10 |
| Ready mix NW 3000 | 0.109 |
| Ready mix NW 4000 | 0.128 |
| Ready mix NW 5000 | 0.152 |
| Ready mix NW 6000 | 0.16 |
| Ready mix NW 8000 | 0.186 |
| Ready mix LW 3000 | 0.273 |
| Ready mix LW 4000 | 0.30 |
| Ready mix LW 5000 | 0.327 |
Steel
The steel policy uses national averages from several steel trade organizations. The user can choose up to a 40% reduction from national averages. These values can be explored with different selections and are tabulated below.
| Steel Element | ECI |
|---|---|
| Hot-rolled sections | 1.08 |
| Rebar and reinforcement | 0.854 |
| Decking | 2.33 |
| Hollow structural sections HSS | 1.99 |
| Cold formed steel framing | 2.44 |
Using the tables above, the tool replaces the user-selected material policy resultant impacts into the A1-A3 impacts per user-selected physical scope and typology.
- ECI(A1-A3)pred= Reduced ECI of life cycle stage A1-A3 of physical scope p
- ECI(A1-A3)pmat= Material policy ECI of life cycle stage A1-A3 of physical scope p
Then, the tool sums the total ECI per physical scope chosen by the user to create a reduced ECI per typology. Physical scopes not chosen by the user for reduction shall use the baseline ECIs. All other life cycle stages besides A1-A3 will use the baseline ECIs.
- ECItred= Reduced ECI of typology t
- ECI(A1-A3)pred= Reduced ECI of life cycle stage A1-A3 of physical scope p. This will be summed over the user-selected physical scopes.
- ECI(L)pbase= Baseline ECI of life cycle stage L of physical scope p. This will be summed over the physical scopes not selected by the user and all life cycle stages excluding A1-A3.
Finally, the tool sums the total GWP per typology by multiplying the user-selected applicable areas to the reduced ECI and the non-selected areas to the baseline ECI, as shown in Eq. 3.
Reuse Incentives
Reuse incentives work differently than other policies in this tool. Because it is in most cases not possible to directly require the reuse of existing buildings, reuse is more likely to be included as one of multiple pathways (such as in CalGreen’s embodied carbon requirements) or directly incentivized. For examples of existing policies and more information about building reuse and other reuse-related policies, see the CLF Deconstruction, Salvage, and Reuse Policies factsheet.
A reuse policy in this model converts new construction floor area into building stock area. Still, there are emissions associated with adaptive reuse, which can be approximated using the CLF WBLCA Benchmark Study v2's minor and major renovation projects. Because of the scarcity of data regarding the allocation of renovation types in North America, the ECIs used by the tool are based on the assumption that half the renovations will be major renovations, and half will be minor renovations.
The process for calculating the effects of a reuse policy involves reducing new construction area and multiplying it by the embodied carbon intensity of renovation projects. The reduction amount is provided by the user, and this reallocated area is multiplied by the embodied carbon intensities of renovation projects tabulated below.
| Typology | Structure | Enclosure | Interiors |
|---|---|---|---|
| Commercial and Multifamily Residential | 105 | 74 | 32 |
As stated above, the tool calculates reuse incentives by modifying both new construction areas and building ECIs. First, the applicable building areas are reduced based on the user input.
- Area(t)appNC= User-selected areas designated for new construction
- Reuse = Percent of new construction to be converted to adaptive reuse. Value is input by user.
- Area(t)appR= User-selected areas designated for adaptive reuse
Using the table above, the tool replaces the new construction A1-A3 impacts with adaptive reuse impacts.
- ECI(A1-A3)pred= Reduced ECI of life cycle stage A1-A3 of physical scope p
- ECI(A1-A3)pR= Adaptive reuse ECI of life cycle stage A1-A3 of physical scope p
Then, the tool calculates the resultant building ECI per typology using Eq. 5. Finally, Total GWP is calculated by multiplying the applicable new construction areas with new construction ECIs and the converted adaptive reuse areas with adaptive reuse ECIs.
- GWPtotal = Total GWP of all typologies
- TYP = typologies of Commercial, Multifamily Residential, and Single Family Residential
- Area(t)NA= Area of typology t not selected by user to be applied to baseline ECI
Policy Phasing
Typically, embodied carbon policies require a phase-in period to acclimate practitioners to the new regulations. Instead of a singular result, most enacted policies typically strengthen over time. Policy phasing allows the user to apply different policy values over time. This is useful for users who wish to understand the different impacts of phasing over time. To apply this policy phasing, select the three different time intervals and policy values. See image below for an explanation of the implementation process.
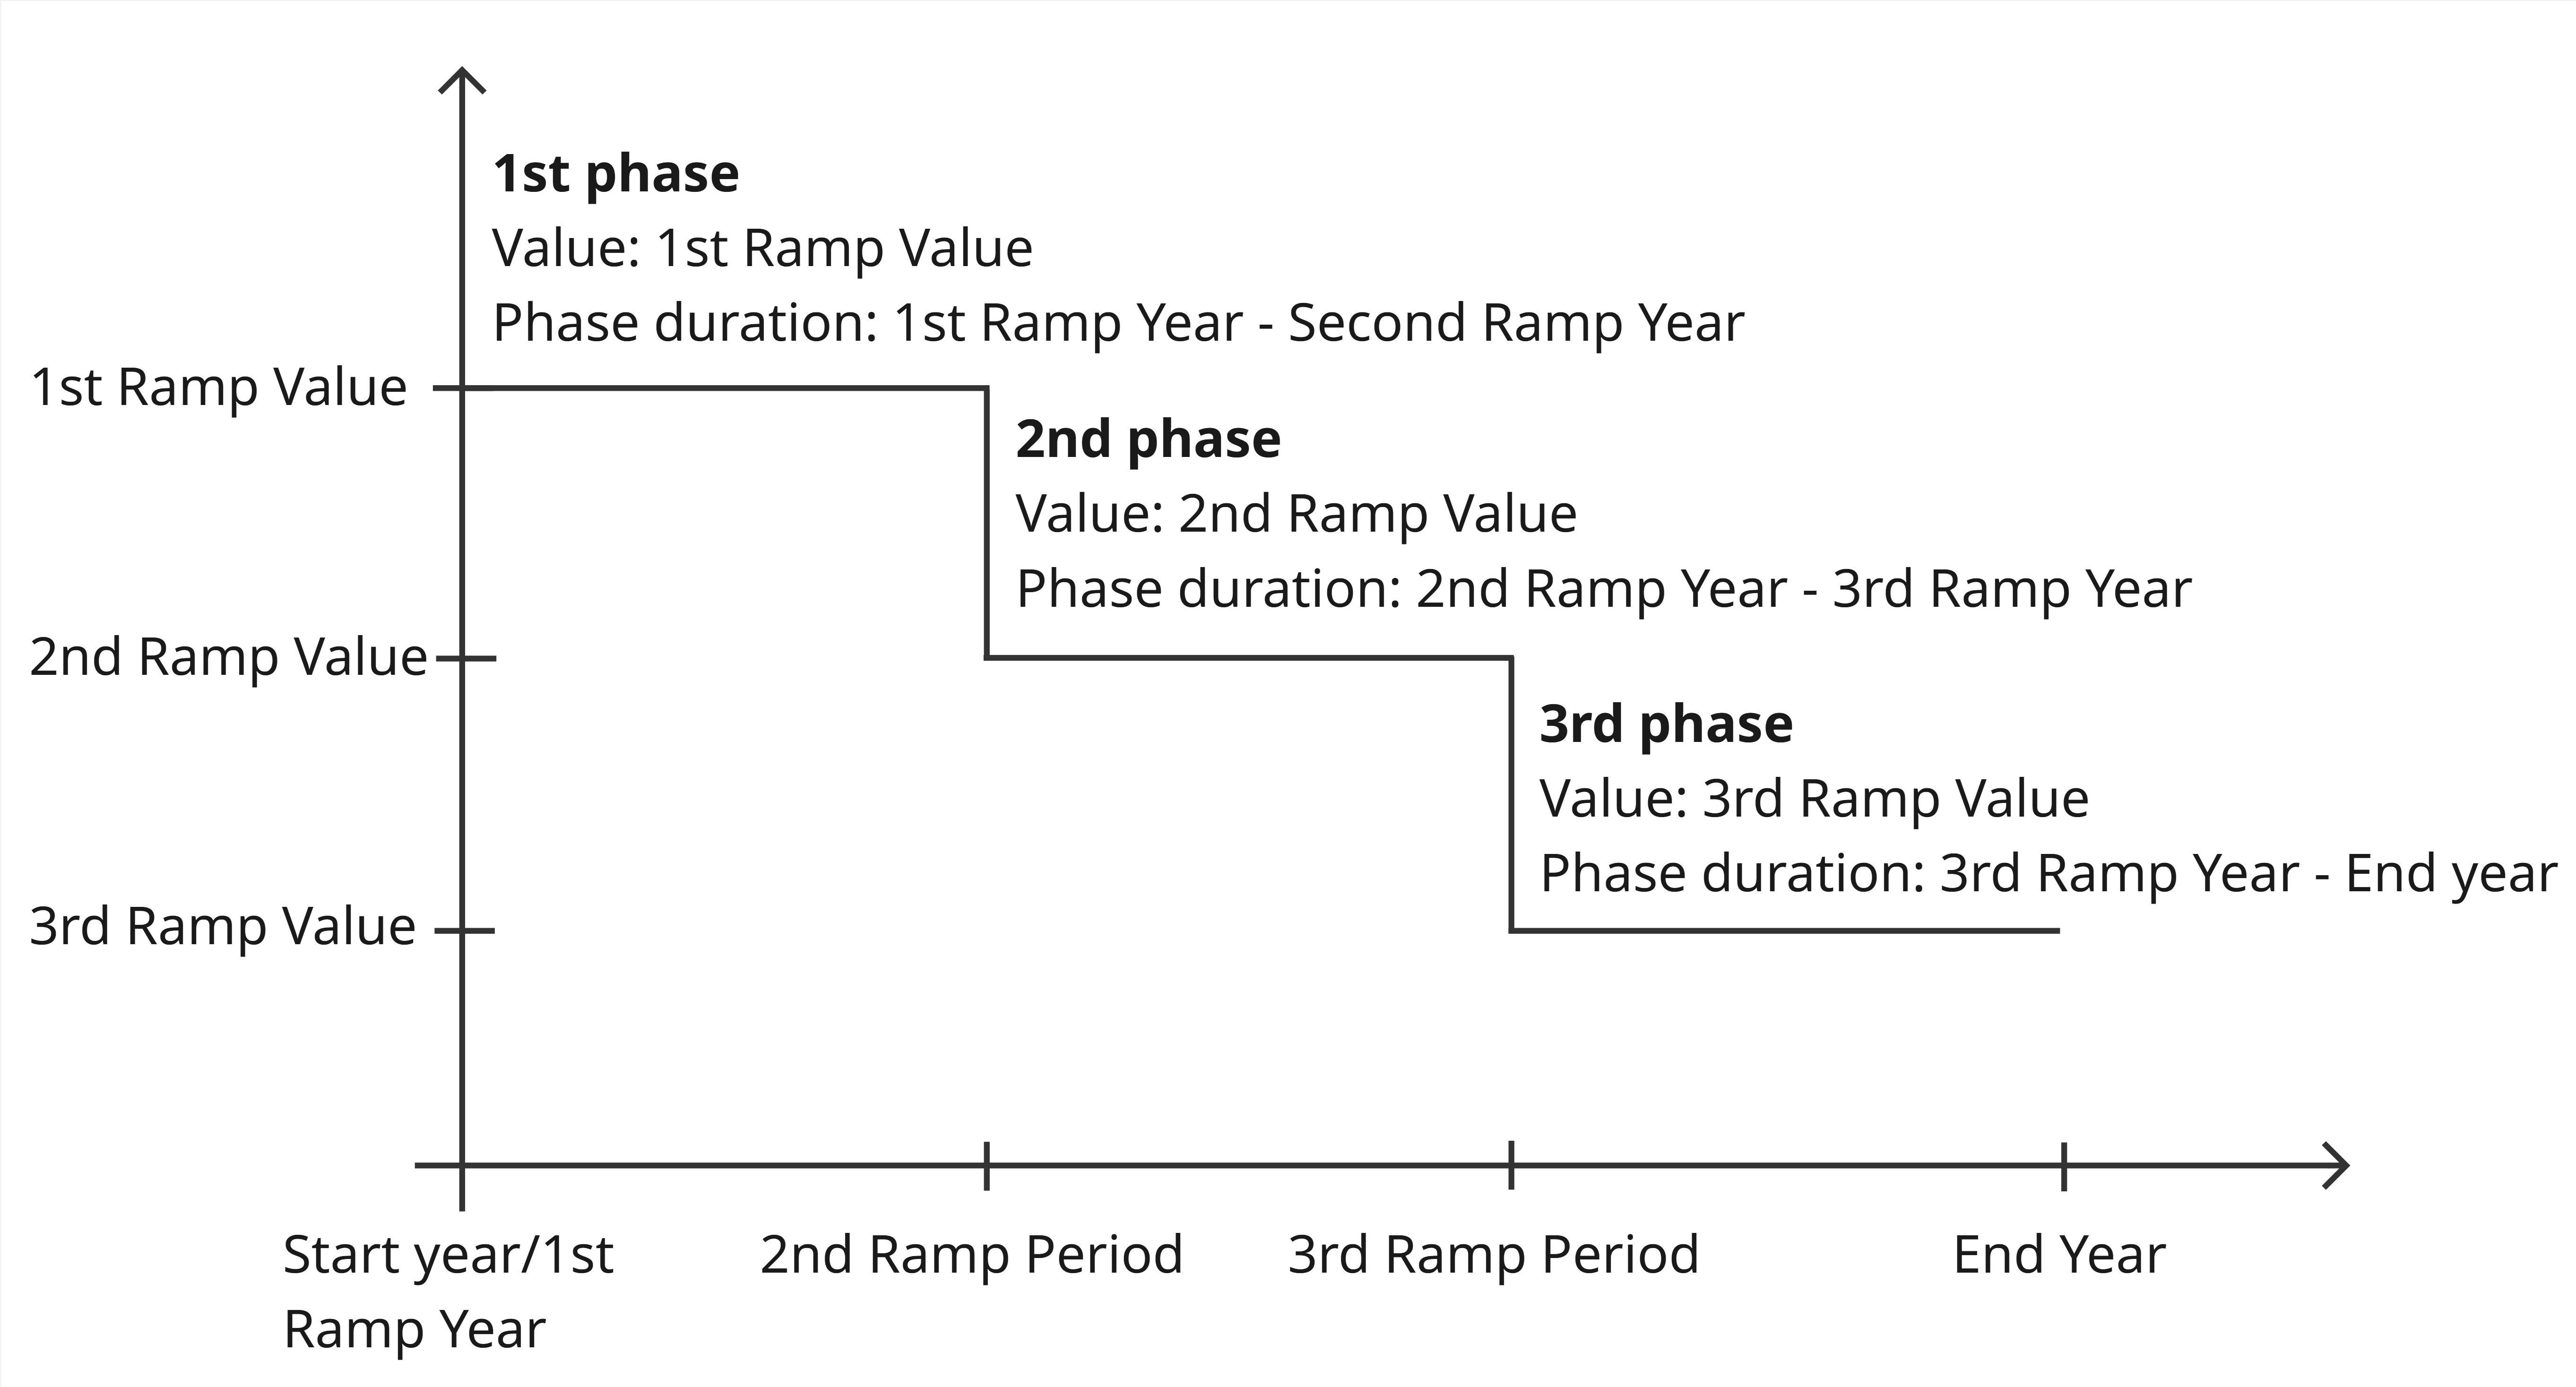
Modeled policies that last less than 5 years are not eligible for policy phasing.
Sources
- Benke, B., Chafart, M., Shen, Y., Ashtiani, M., Carlisle, S., & Simonen, K. (2025). A Harmonized Dataset of High-Resolution Embodied Life Cycle Assessment Results for Buildings in North America. Scientific Data, 12(1), 1085. https://doi.org/10.1038/s41597-025-05216-0
- National Ready Mix Concrete Association (NRMCA). (2021). A Cradle-to-Gate Life Cycle Assessment of Ready-Mixed Concrete Manufactured by NRMCA Members – Version 3.2. https://www.nrmca.org/wp-content/uploads/NRMCA_LCAReportV3.2_2023.pdf