Embodied Carbon Intensities
A description of embodied carbon intensity data
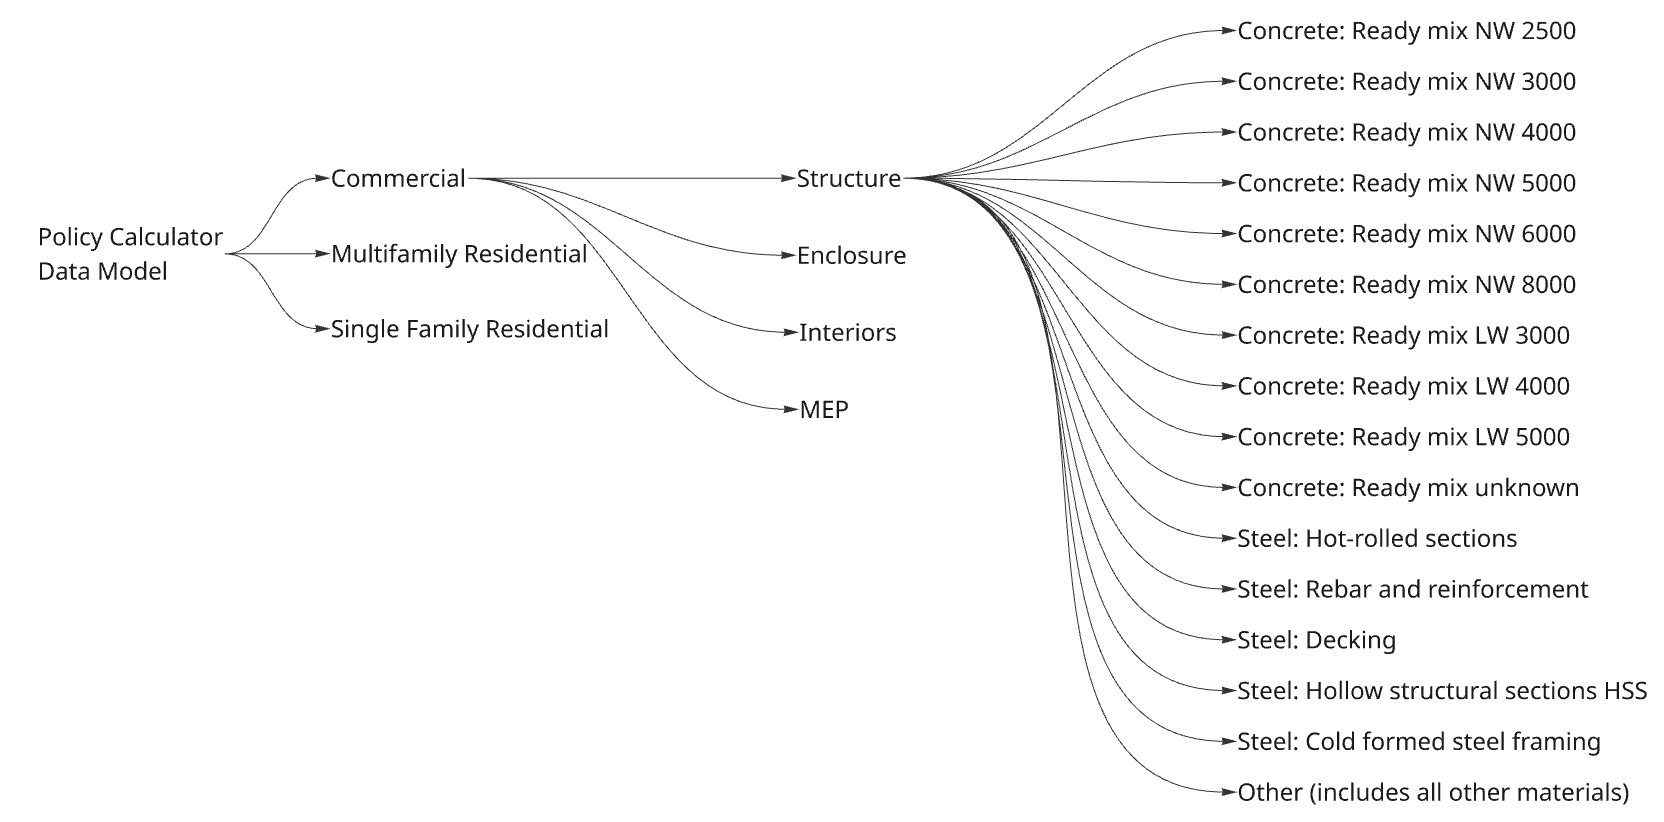
Embodied Carbon Intensities (ECIs) are an integral part of the data model of the Embodied Carbon Policy Reduction Calculator for Buildings. These values provide the estimated carbon emissions for buildings in the United States. The data model for this tool divides the total embodied carbon emissions of buildings into typologies, physical scopes, and materials, as described in the image below.
In each section, we will document each methodology and source used to calculate the emissions of each life cycle stage and according to respective typologies, scopes, and materials where applicable. Tables of ECIs values used in the baseline data model are also provided.
Life Cycle Stages A1-A3
Life cycle stages A1-A3 refer to the raw material supply, transportation to manufacturing site, and manufacturing of a given material.
For commercial and multifamily residential typologies, we used average emissions from the CLF WBLCA Benchmark Study v21 to provide A1-A3 impacts for structure, enclosure, and interiors. The CLF WBLCA Benchmark Study v2 includes 199 commercial buildings and 44 multifamily residential buildings.
For single family residential, we used data from existing literature on single family home emissions. We conducted a literature review of the following studies:
- Emissions of Materials Benchmark Assessment for Residential Construction (n=503)2
- Embodied carbon benchmarks of single-family residential buildings in the United States (n=64)3
- Establishing the Average Upfront Material Carbon Emissions in New Low-Rise Residential Home Construction in the City of Nelson & the City of Castlegar (n=34)4
- Material emissions benchmark report for Part 9 Homes in Vancouver (n=13)5
- Internal CLF research working with the Oregon Department of Environmental Quality (n=3)
See table below for a summary of ECIs for structure, enclosure, and interiors for the different studies. The final values used in the tool are the weighted average based on the number of projects in each study.
| Typology | EMBARC | Jungclaus | Nelson study | Part 9 study | Oregon DEQ | Weighted Average |
|---|---|---|---|---|---|---|
| Structure | 78.1 | 42 | 62.1 | 76.2 | 40.4 | 73.3 |
| Enclosure | 97.6 | 27.6 | 69.6 | 80.1 | 33.1 | 88.1 |
| Interiors | 21.3 | 10.4 | 18.0 | 19.3 | 23.3 | 19.9 |
Finally, for MEP impacts for the three typologies, we used an estimate from a commercial project in the MEP2040 Beginner's Guide6. For Multifamily and Single Family Residential, 50% of the commercial MEP value was used as a rough approximation for A1-A3 MEP impacts. This is a coarse estimate used in the baseline mainly to provide context for the reductions in the policy models which mostly focus on reducing structure, enclosure and interiors scope. The resulting A1-A3 baseline ECIs for structure, enclosure, interiors, and MEP per building typologies are listed below.
| Typology | Structure | Enclosure | Interiors | MEP |
|---|---|---|---|---|
| Commercial | 295 | 108 | 21 | 128 |
| Multifamily Residential | 204 | 72 | 26 | 64 |
| Single Family Residential | 73 | 88 | 20 | 64 |
To calculate the total GWP of the A1-A3 life cycle stages, first we summed the ECIs using the given equation:
- ECI(A1-A3)t = ECI of typology t
- PS = physical scopes of Structure, Enclosure, Interiors, and MEP
Next, the areas were summed per a given typology using the given equation:
- Area(NC)t = new construction area of typology t
- a = individual area belonging to typology t. For example, for the multifamily residential typology, the applicable areas are "Multifamily Residential buildings with 2-4 units" and "Multifamily Residential buildings with 5+ units".
Finally, the total GWP was calculated using the given equation:
- GWPA1-A3 = Total GWP for life cycle stages A1-A3
- TYP = typologies of Commercial, Multifamily Residential, and Single Family Residential
Life Cycle Stage A4
Life cycle stages A4 refers to the impacts associated with the transportation to the construction site for a given material.
For commercial and multifamily residential typologies, we used average emissions from the CLF WBLCA Benchmark Study v2 to provide A4 impacts for structure, enclosure, and interiors. For single family residential, a proxy A4 impact was calculated by multiplying single family residential A1-A3 impacts by the ratio of A4 impacts to A1-A3 impacts for multifamily residential per physical scope.
- ECI(A4)SFp= ECI of life cycle stage A4 for Single Family Residential of physical scope p
- ECI(A1-A3)SFp= ECI of life cycle stage A1-A3 for Single Family Residential of physical scope p
- ECI(A4)MFp= ECI of life cycle stage A4 for Multifamily Residential of physical scope p
- ECI(A1-A3)MFp= ECI of life cycle stage A1-A3 for Multifamily Residential of physical scope p
For example, the ratio of A4 impacts to A1-A3 impacts for Structure for multifamily residential is 3.48%. This value, multiplied by the A1-A3 Structure impacts for single family residential equals 1.8 kgCO2/m2, as shown in the table of A4 baseline ECIs tabulated below.
For MEP impacts, A1-A3 impacts were multiplied by the ratio of the sum of A4 impacts of structure, enclosure, and interiors to the sum of A1-A3 impacts of structure, enclosure, and interiors for each building typology.
- ECI(A4)tMEP= ECI of life cycle stage A4 for typology t for MEP
- ECI(A1-A3)tMEP= ECI of life cycle stage A1-A3 for typology t for MEP
- ECI(A4)tp= ECI of life cycle stage A4 for typology t of physical scope p. These values will be summed for structure, enclosure, and interiors for a given typology t.
- ECI(A1-A3)tp= ECI of life cycle stage A1-A3 for typology t of physical scope p. These values will be summed for structure, enclosure, and interiors for a given typology t.
The tool calculates A4 impacts using the tabulated ECIs above similarly to Eqs. 1-3. The resulting A4 baseline ECIs for structure, enclosure, interiors, and MEP per building typologies are listed below.
| Typology | Structure | Enclosure | Interiors | MEP |
|---|---|---|---|---|
| Commercial | 10.3 | 1.4 | 0.5 | 3.7 |
| Multifamily Residential | 7.1 | 1.3 | 0.9 | 2 |
| Single Family Residential | 2.5 | 1.6 | 0.7 | 1.7 |
Life Cycle Stage A5.2
Life cycle stages A5.2 refers to the impacts associated with onsite construction activities.
Following guidance from ASHRAE 240p7, the recommended A5.2 impacts are 40 kgCO2/m2. For the purposes of this tool, the values were spread across the different physical scopes. For a given building typology, the emissions allocated to each physical scope is based on the ratio of A1-A3 impacts of a given physical scope compared to the total emissions of the building typology.
- ECI(A5.2)tp= ECI of life cycle stage A5.2 for typology t of physical scope p
- ECI(A1-A3)tp= ECI of life cycle stage A1-A3 for typology t of physical scope p.
The tool calculates A5.2 impacts using the tabulated ECIs above similarly to Eqs. 1-3. The resulting A5.2 baseline ECIs for structure, enclosure, interiors, and MEP per building typologies are listed below.
| Typology | Structure | Enclosure | Interiors | MEP |
|---|---|---|---|---|
| Commercial | 21.4 | 7.8 | 1.5 | 9.3 |
| Multifamily Residential | 22.3 | 7.9 | 2.8 | 7 |
| Single Family Residential | 11.9 | 14.4 | 3.2 | 10.4 |
Life Cycle Stage A5.3
Life cycle stages A5.3 refers to the impacts associated with construction wastage per material.
Following guidance from the 2025 draft of ASHRAE 240p, the recommended construction wastage rates used in the tool are as follows:
- Steel: 10%
- Rebar and reinforcement: 3%
- Wood and composites: 10%
- Glazing: 1%
- Aluminum: 1%
- All other materials (including concrete): 5%
To generate ECI impacts for A5.3, these wastage rates are applied to the A1-A3 and A4 ECI impacts for each typology and physical scope.
- ECI(A5.3)m= ECI of life cycle stage A5.3 for material m
- Wm = Wastage rate of material m
- ECI(A1-A3)m= ECI of life cycle stage A1-A3 for material m
- ECI(A4)m= ECI of life cycle stage A4 for material m
The C2-C4 impacts associated with A5.3 are not included within the scope of this calculator. The tool calculates A5.3 impacts using the tabulated ECIs above similarly to Eqs. 1-3. The resulting A5.3 baseline ECIs for structure, enclosure, interiors, and MEP per building typologies are listed below.
| Typology | Structure | Enclosure | Interiors | MEP |
|---|---|---|---|---|
| Commercial | 17.9 | 2.3 | 0.7 | 5.1 |
| Multifamily Residential | 10.3 | 1.7 | 0.8 | 2.6 |
| Single Family Residential | 7.4 | 8.1 | 2 | 2.6 |
Life Cycle Stage B4
Life cycle stage B4 refers to the impacts associated with the replacement of materials in a building during occupancy.
Replacement impacts require a shift in methodology as compared to impacts applied to new construction building areas. This methodology is described in more depth in CLF's Washington State Carbon Emissions Estimation: 2025 - 20508. In this paradigm, replacement impacts are evaluated on an annual basis across the entire building stock. By doing so, this methodology breaks from typical Life Cycle Assessment, which focuses on the life cycle of a single building or collection of buildings. Here, replacement impacts are assumed to occur on an annual basis, but only a percentage of the building stock sees those replacements in any given year. That percentage is based on the replacement rate of each physical scope, where the total impacts are multiplied by 1 divided by the service life to create a yearly replacement impact.
- ECI(B4)p= ECI of life cycle stage B4 of physical scope p
- Sp = Service life of physical scope p
- ECI(A1-A3)p= ECI of life cycle stage A1-A3 of physical scope p
Each material corresponding to a physical scope was assumed to have the following service life:
- Structure: 60 years*
- Enclosure: 45 years
- Interiors: 15 years
- MEP: 27.5 years
*For structures, the tool calculates replacement impacts as the calculated structural ECI of renovation projects from the CLF Benchmark Study v2 in lieu of the calculated structural new construction ECI. In this instance, the 60 years service life is not functioning as a typical service life, rather it is indicating that a significant structural renovation is anticipated approximately every 60 years.
Commercial and multifamily projects utilize the replacement impacts from the CLF Benchmark Study v2 for enclosure and interiors. Single family projects use the A1-A3 impacts from an internal literature review for structure, enclosure, and interiors. The tool calculates B4 impacts using the tabulated ECIs above similarly to Eqs. 1-3, except the tool uses building stock areas for B4 impacts instead of new construction areas. The resulting B4 baseline ECIs for structure, enclosure, interiors, and MEP per building typologies per year are listed below.
| Typology | Structure | Enclosure | Interiors | MEP |
|---|---|---|---|---|
| Commercial | 1.975 | 2.39 | 1.385 | 4.655 |
| Multifamily Residential | 1.975 | 1.604 | 1.709 | 2.327 |
| Single Family Residential | 1.221 | 1.958 | 1.329 | 2.327 |
Life Cycle Stages C2-C4
Life cycle stages C2-C4 refer to the impacts associated with end-of-life of a given material.
End-of-life impacts follow a similar methodology to the replacement impacts. End-of-life impacts are assumed to occur every year but only affect a percentage of the projects based on the demolition rates in the United States, estimated to be 0.23% based on an estimate by the US Department of Energy9. Commercial and multifamily projects utilize the end-of-life impacts from the CLF Benchmark Study v2 for structure, enclosure, and interiors.
- ECI(B4)p= ECI of life cycle stage C2-C4 of physical scope p
- ECI(C2-C4)p= ECI of life cycle stage C2-C4 of physical scope p from Benchmark Study. These values are only applicable for structure, enclosure, and interiors.
For single family residential, a proxy end-of-life impact was calculated by multiplying single family residential A1-A3 impacts by the ratio of end-of-life impacts to A1-A3 impacts for multifamily residential per physical scope (similar to calculations of transportation impacts).
- ECI(C2-C4)SFp= ECI of life cycle stages C2-C4 for Single Family Residential of physical scope p
- ECI(A1-A3)SFp= ECI of life cycle stage A1-A3 for Single Family Residential of physical scope p.
- ECI(C2-C4)SFp= ECI of life cycle stage C2-C4 for Multifamily Residential of physical scope p.
- ECI(A1-A3)tp= ECI of life cycle stage A1-A3 for Multifamily Residential of physical scope p.
For MEP impacts, A1-A3 impacts were multiplied by the ratio of the sum of end-of-life impacts of structure, enclosure, and interiors to the sum of A1-A3 impacts of structure, enclosure, and interiors for commercial and multifamily residential projects.
- ECI(C2-C4)tMEP= ECI of life cycle stage C2-C4 for typology t for MEP
- ECI(A1-A3)tMEP= ECI of life cycle stage A1-A3 for typology t for MEP
- ECI(C2-C4)tp= ECI of life cycle stage C2-C4 for typology t of physical scope p. These values will be summed for structure, enclosure, and interiors for a given typology t.
- ECI(A1-A3)tp= ECI of life cycle stage A1-A3 for typology t of physical scope p. These values will be summed for structure, enclosure, and interiors for a given typology t.
The tool calculates C2-C4 impacts using the tabulated ECIs above similarly to Eqs. 1-3, except the tool uses building stock areas for C2-C4 impacts instead of new construction areas. The resulting C2-C4 baseline ECIs for structure, enclosure, interiors, and MEP per building typologies per year are listed below.
| Typology | Structure | Enclosure | Interiors | MEP |
|---|---|---|---|---|
| Commercial | 0.067 | 0.019 | 0.007 | 0.028 |
| Multifamily Residential | 0.054 | 0.013 | 0.011 | 0.017 |
| Single Family Residential | 0.019 | 0.016 | 0.009 | 0.016 |
Sources
- Benke, B., Chafart, M., Shen, Y., Ashtiani, M., Carlisle, S., & Simonen, K. (2025). A Harmonized Dataset of High-Resolution Embodied Life Cycle Assessment Results for Buildings in North America. Scientific Data, 12(1), 1085. https://doi.org/10.1038/s41597-025-05216-0
- Magwood, C., Bowden, E., & Trottier, M. (2022). Emissions of Materials Benchmark Assessment for Residential Construction (Passive Buildings Canada and Builders for Climate Action). Passive Buildings Canada and Builders for Climate Action.
- Jungclaus, M. A., Grant, N., Torres, M. I., Arehart, J. H., & Srubar, W. V. (2024). Embodied carbon benchmarks of single-family residential buildings in the United States. Sustainable Cities and Society, 117, 105975.
- Magwood, C., Bowden, E., Treadaway, E., Ahmad, J., Deluca, M., & Douglas, N. (2022). Establishing the Average Upfront Material Carbon Emissions in New Low-Rise Residential Home Construction in the City of Nelson & the City of Castlegar. Builders for Climate Action.
- Magwood, C., & Trottier, M. (2022). material emissions benchmark report for Part 9 Homes in Vancouver.
- Houde, K., Jensen, A., & Shinn, K. (2025). The Beginner’s Guide to MEP Embodied Carbon. MEP 2040. https://www.mep2040.org/guide
- ASHRAE, ICC, & BSR. (2025). Standard 240P: Quantification of Life Cycle Greenhouse Gas Emissions, Second ISCPublication Public Review Draft. ASHRAE.
- Jensen, A., Chafart, M., Raju, S., & Lewis, M. (2025). Washington State Carbon Emissions Estimation: 2025 - 2050. Carbon Leadership Forum.
- US Department of Energy. (2022). Residential Demand Module of the National Energy Modeling System Model.